

What If BRICS Surpassed the G7? A Data-Driven Look at the Global Power Shift
📊 Exploring How BRICS Could Reshape the Global Economy, Trade, and Politics with Real Data Insights

Update, 2026: The AI Operator has narrowed its focus to AI and building with AI in production. This post is from before that shift. If that’s what you’re here for, start with I rebuilt Karpathy’s LLM Wiki, I built this for myself. Then 1,374 strangers cloned it., or what The AI Operator is now.
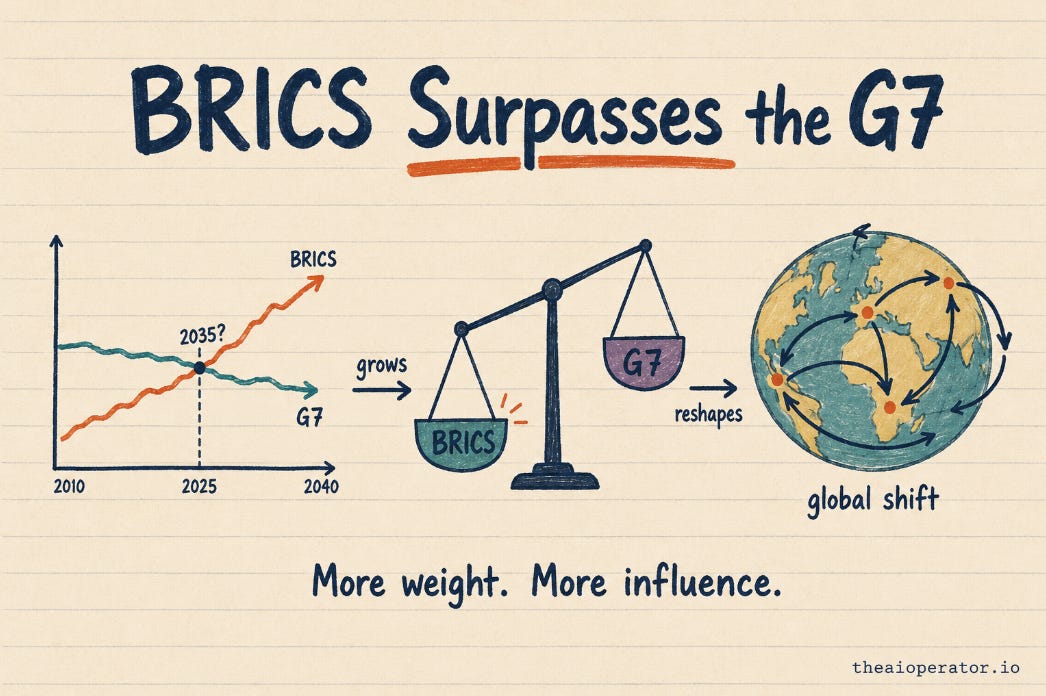
The global balance of power has long been dominated by the G7 nations: Canada, France, Germany, Italy, Japan, the United Kingdom, and the United States. However, an emerging bloc—BRICS (Brazil, Russia, India, China, and South Africa)—is rapidly gaining economic and geopolitical influence.
What would it mean if BRICS overtook the G7? This scenario is not just speculation but a plausible future based on economic growth trends, demographic advantages, and increasing global trade. This article explores this shift through data-driven insights, uncovering how it could reshape the global economy, trade systems, and political dynamics.
With compelling data, engaging visuals, and a clear narrative, this analysis dives deep into the potential transformation of global power.
1. Economic Power: GDP Comparisons
The economic power of BRICS and G7 has been a focal point in global politics. Let’s examine how these groups compare in GDP terms, both nominally and adjusted for Purchasing Power Parity (PPP), while considering the role of individual member nations.
Current GDP (2023): Nominal vs. PPP
G7 Combined Nominal GDP: $42.8 trillion
BRICS Combined Nominal GDP: $27.6 trillion
However, when adjusted for PPP, BRICS takes the lead:
G7 Combined GDP (PPP): $43.7 trillion
BRICS Combined GDP (PPP): $57.7 trillion
This highlights that BRICS, when measured in terms of purchasing power, already has a stronger economic output than G7, driven by lower costs of goods and services in countries like China and India.
GDP Contribution by Country
In 2023, the GDP contributions of BRICS countries are heavily skewed towards China and India:
China: ~70% of BRICS GDP
India: ~13%
Russia: ~7%
Brazil: ~6%
South Africa: ~1.5%
While China and India dominate in GDP size, Russia’s economic strength lies in its vast energy and resource exports, which contribute significantly to BRICS' overall influence.
For G7:
United States: ~50% of G7 GDP
Japan: ~10%
Germany: ~9%
The remaining G7 countries collectively make up ~31%.
This disparity highlights the internal imbalances in both blocs, with BRICS relying heavily on China and G7 on the U.S.
GDP Growth Trends
BRICS countries are growing faster than G7 nations:
G7 Annual Growth Rate (Last Decade): ~1.8%
BRICS Annual Growth Rate (Last Decade): ~4.5%
At these rates:
By 2035, BRICS could overtake G7 in nominal GDP.
By 2040, BRICS' PPP advantage could expand significantly.
China and India will lead this growth due to their large populations, expanding middle class, and technological advancements, while Russia and Brazil maintain key roles as resource giants.
Future Projections
Using current growth trajectories:
BRICS Nominal GDP (2040): ~$75 trillion
G7 Nominal GDP (2040): ~$55 trillion
The dominance of BRICS will be driven by China, India, and Russia, which contribute over 90% of the bloc's GDP.
 maintaining higher GDP initially, but BRICS (yellow dashed line) steadily growing and overtaking G7 around the year 2035, marked as the crossover point. The x-axis represents years (2000-2040), and the y-axis shows GDP in trillion USD. The background is dark, with labeled lines and a clear legend highlighting the GDP trends for both groups.")
Key Takeaways
BRICS already surpasses G7 in real output (PPP), highlighting its growing relevance in global economics.
By 2040, BRICS could dominate in nominal GDP as well, with China and India leading, supported by Russia’s resource strength and Brazil’s agricultural prowess.
2. Population Dynamics and Workforce
The size and composition of a nation’s population are critical factors in its economic potential. BRICS and G7 show significant differences in population dynamics, which could shape their long-term economic trajectories.
Population Size (2023)
BRICS Population: 3.2 billion (over 40% of the world’s total population).
G7 Population: 774 million (around 10% of the world’s total population).
This massive population advantage gives BRICS a larger pool of labor, consumers, and innovation potential.
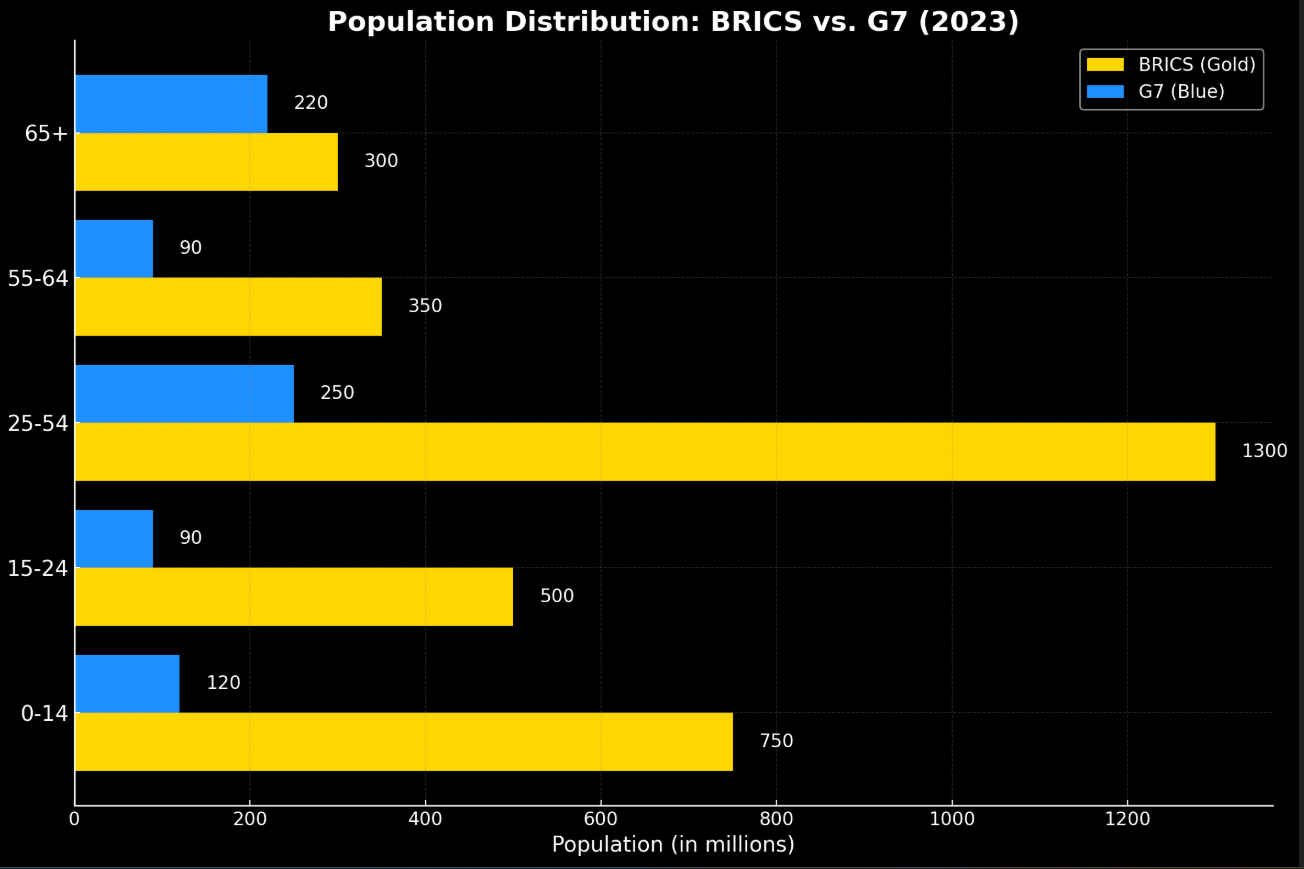
Workforce and Demographics
BRICS Workforce (Ages 15-64): ~2.1 billion
G7 Workforce (Ages 15-64): ~500 million
BRICS also has a younger population, with a median age of 32 years compared to 43 years in G7 nations. This demographic dividend is an advantage for BRICS, as it ensures a growing labor force for decades, while G7 countries face challenges from aging populations and shrinking workforces.
Aging Populations in G7
Over 20% of G7 populations are aged 65 or older, straining pension systems and healthcare infrastructure.
In contrast, BRICS has a much smaller proportion of elderly populations, enabling greater economic productivity.
Key Insights
BRICS nations have a clear advantage regarding the working-age population, which can drive economic growth.
G7 nations face challenges from aging populations, leading to increased dependency ratios and reduced productivity.
The demographic edge of BRICS provides a foundation for sustained economic expansion.
3. Trade and Global Influence
Trade relationships are pivotal to understanding the shifting dynamics between BRICS and G7. As BRICS nations strengthen intra-bloc trade and diversify their partnerships, the G7 faces challenges from slower growth and reduced global trade dominance. This section explores how these two blocs compare and how their trade shares are projected to evolve until 2040.
Global Trade Share: Current Status (2023)
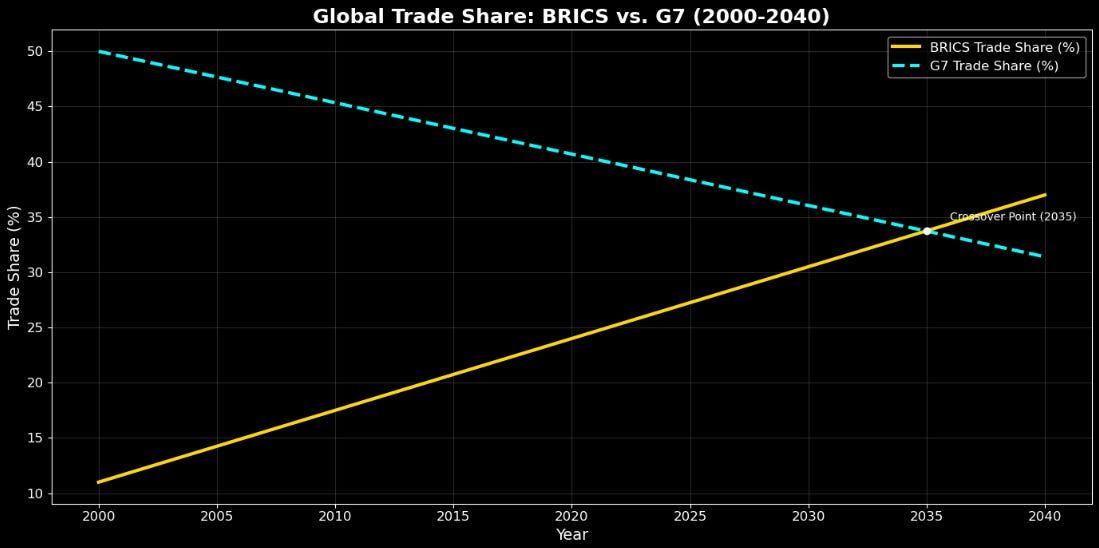
BRICS Share of Global Trade: 18%
This share has grown from 11% in 2000, driven by resource exports, manufacturing, and partnerships in emerging markets.
G7 Share of Global Trade: 31%
Declined from 50% in 2000 due to stagnating trade in high-income economies and competition from emerging markets.
Key Export and Import Relationships
BRICS Highlights:
China: Largest exporter of goods globally, accounting for 30% of BRICS trade volume.
Russia: A major energy exporter, supplying oil and natural gas to BRICS members and beyond.
India: A leader in pharmaceuticals and IT services, serving as a bridge to the Global South.
Brazil: Dominates agricultural exports, supplying soybeans, beef, and sugar.
South Africa: Key exporter of minerals, particularly platinum and gold.
G7 Highlights:
United States: Dominates in high-value exports such as aerospace, technology, and financial services.
Germany and Japan: Leaders in automotive and machinery exports.
Canada: Resource-rich economy with strong ties to the US through trade agreements like USMCA.
Diversification Strategies
BRICS Initiatives:
Reducing Dollar Dependency:
Bilateral trade agreements in local currencies (e.g., India-Russia trade in rupees).
Plans for a BRICS Reserve Currency backed by gold and natural resources.
Global South Partnerships:
Major investments in Africa and Latin America for infrastructure and resource access.
Increased trade volumes with countries like Argentina, Iran, and Saudi Arabia.
Infrastructure Investments:
China’s Belt and Road Initiative (BRI): Over $1 trillion invested in trade routes across 150 countries.
New Development Bank (NDB): Funding major infrastructure projects in member nations.
G7 Strategies:
Reinforcing Alliances:
Trade agreements like USMCA (United States-Mexico-Canada Agreement) and EU trade deals.
Strengthened military-economic collaborations through NATO.
Focus on Advanced Technologies:
Investments in AI, semiconductors, and renewable energy.
Leading innovations in green energy transitions, like the European Green Deal.
Trade Growth Trends and Projections
BRICS Growth Rate: +0.65% annually (approx)
Driven by investments in infrastructure, expansion of partnerships in the Global South, and reduced dependency on the US dollar.
G7 Decline Rate: -0.46% annually (approx)
Reflecting saturated markets, demographic challenges, and rising competition from emerging economies.
Projected Trade Shares (2040):
BRICS: 35%
Continues to rise beyond 2035, when BRICS overtakes G7 in trade share.
G7: 25%
Declines steadily due to slower growth in high-income economies and reduced global influence.
Visualization: Global Trade Share (2000-2040)
Key Insights Until 2040
BRICS Dominance:
BRICS trade share is projected to increase from 18% in 2023 to 35% by 2040, driven by:Strategic partnerships in Africa, Latin America, and Southeast Asia.
Enhanced intra-bloc trade facilitated by investments like the Belt and Road Initiative.
Diversification of trade away from USD, leveraging local currencies.
G7 Decline:
G7 trade share is expected to decline from 31% in 2023 to 25% by 2040, primarily due to:Aging populations and slower GDP growth.
Reduced competitiveness in emerging markets.
Increasing competition from technologically advancing BRICS nations like China and India.
Crossover Point (2035):
BRICS overtakes G7 in global trade share, marking a symbolic shift in global economic influence.
4. Currency Shifts and De-Dollarization
One of the most significant global economic trends is BRICS' push to reduce reliance on the US dollar in international trade. By adopting local currencies and exploring the possibility of a unified BRICS reserve currency, the bloc is challenging G7’s dominance in global financial systems.
Current Global Reserve Currency Shares (2023)
US Dollar (USD): 58% of global reserves.
Euro (EUR): 20%, predominantly within the EU and G7 countries.
Other Currencies (JPY, GBP, CAD): 15% collectively.
BRICS Currencies (CNY, INR, RUB, BRL, ZAR): 7%, a small but growing share.
Despite BRICS' small share in reserves, their currency initiatives are reshaping financial systems globally.
BRICS De-Dollarization Strategies
Bilateral Trade in Local Currencies:
India and Russia: Trading in Indian Rupees and Russian Rubles for oil and defense equipment.
China: Agreements with over 40 countries to use the Yuan (CNY) in trade settlements.
Unified BRICS Reserve Currency:
Discussed in recent BRICS summits, this currency could be backed by gold, natural resources, or a basket of BRICS currencies.
Aim: Reduce reliance on the US-dominated SWIFT payment system and mitigate exposure to sanctions.
New Development Bank (NDB):
Provides funding for infrastructure projects in BRICS and developing countries, reducing dependency on IMF and World Bank loans.
Impact on G7
Declining USD Dominance:
The share of USD in global reserves has fallen from 70% in 2000 to 58% in 2023, reflecting growing global diversification.
Increased Currency Competition:
G7 currencies face competition as BRICS countries encourage local currency use in trade with the Global South.
Projection: Currency Shares (2040)
If BRICS continues its de-dollarization efforts:
BRICS Currencies: Expected to grow to 20-25% of global reserves.
US Dollar: Likely to decline to 50% or lower.
Euro and Other Currencies: Expected to remain stable or face slight declines.
Visualization: Global Reserve Currency Shares

Key Insights
Rising Influence of BRICS Currencies:
BRICS' strategic push for de-dollarization will likely result in a significant increase in their global reserve share by 2040.Declining G7 Currency Dominance:
The USD will remain dominant but face increasing competition from BRICS, particularly the Chinese Yuan.Global Financial System Transformation:
BRICS' initiatives could challenge the current financial order, reducing the West's ability to impose economic sanctions and influencing global trade patterns.
5. Energy and Resource Control
Energy and natural resources are vital to global economic influence. BRICS countries, endowed with abundant resources, have a strategic advantage over the G7 in fueling economic growth and influencing global energy markets.
Global Energy Market Influence
BRICS Energy Dominance:
Oil Reserves: BRICS holds ~33% of the world’s proven oil reserves, led by Russia and Brazil.
Natural Gas: Russia alone controls over 20% of global reserves.
Coal: China and India are the world’s largest coal producers, accounting for over 50% of global output.
Renewable Resources: Brazil dominates in biofuels and hydropower, while China leads in solar and wind energy production.
G7 Energy Challenges:
Dependency: Many G7 countries rely on imports for energy, particularly from BRICS nations (e.g., Europe’s reliance on Russian natural gas before 2022).
Transition Costs: G7 countries are investing heavily in renewable energy but face high costs and slower adoption due to aging infrastructure.
Resource Control Beyond Energy
Rare Earth Elements:
China dominates rare earth production, supplying ~63% of global demand, critical for electronics, defense, and renewable technologies.Agricultural Exports:
Brazil is a global leader in soybeans, coffee, and beef exports, with China being its largest customer.
Russia and India excel in grain and rice production, securing food supply for BRICS and export partners.
Projected Resource Trends (2040)
BRICS Growth in Renewable Energy:
China aims to produce 50% of global solar panels and batteries by 2040.
India is set to double its renewable energy output, focusing on wind and solar.
Resource-Based Influence:
BRICS nations will leverage their resource dominance to strengthen geopolitical ties with the Global South.
G7’s Renewable Leadership:
Despite current energy dependency, G7 countries are likely to lead in clean energy innovation, including hydrogen fuel and advanced nuclear technologies.
Visualization: Energy Reserves Comparison
, 700 billion BOE (natural gas), and 1,500 billion BOE (coal). G7 leads in renewables with 900 billion BOE, while BRICS has 600 billion BOE in renewables. The chart uses gold bars for BRICS and cyan bars for G7, with clear labels and data annotations for each category.")
Key Insights
BRICS Energy Dominance:
BRICS controls vast reserves of oil, gas, and coal while leading in renewable energy production through China and Brazil.
G7 Renewable Innovation:
G7 countries are likely to excel in clean energy innovation, but dependency on imports for key resources will remain a challenge.
Rare Earth Control:
China’s dominance in rare earth elements strengthens BRICS’ control over future technologies, from EV batteries to advanced defense systems.
6. Geopolitical Implications
The shift in economic and trade dominance from G7 to BRICS carries profound geopolitical consequences. As BRICS nations assert greater influence on global governance, military alliances, and cultural dynamics, the traditional balance of power is poised for significant transformation.
Global Governance
BRICS Challenges to Western Institutions:
IMF and World Bank Alternatives:
The New Development Bank (NDB) and Contingent Reserve Arrangement (CRA) provide BRICS nations with financial independence, reducing reliance on G7-dominated institutions.UN Reform Advocacy:
BRICS nations are pushing for greater representation in the United Nations, particularly India and Brazil seeking permanent seats on the Security Council.
G7 Response:
Continued influence through NATO and alliances like the OECD to maintain control over global economic policies.
Strengthened partnerships with non-BRICS emerging economies.
Military Influence
BRICS Military Cooperation:
Russia leads in defense exports to BRICS members, with India as its largest customer.
Joint military exercises, such as the BRICS Summit Naval Drills, demonstrate growing defense collaboration.
G7 Military Dominance:
NATO ensures that G7 nations maintain superior global military power.
The U.S. accounts for 70% of NATO’s total defense budget, dwarfing BRICS military expenditures.
Cultural Influence
BRICS Soft Power:
China: Expanding global influence through Confucius Institutes and media channels like CGTN.
India: Bollywood films and yoga have global appeal, strengthening cultural ties with the Global South.
Brazil: Promotes its culture through sports and entertainment, particularly football.
G7 Cultural Leadership:
Dominates global media, technology, and education, with Hollywood and Silicon Valley as key drivers.
Soft power advantages include prestigious universities and global English language dominance.
Visualization: Geopolitical Initiatives Timeline
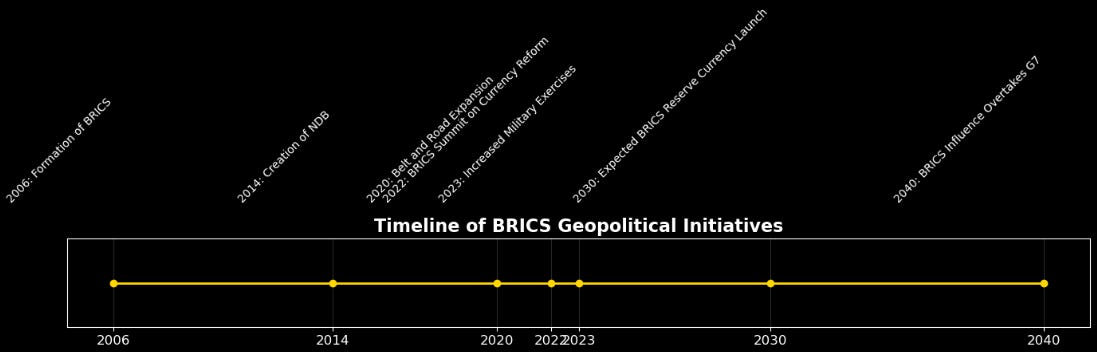
Key Insights
Global Governance Shift:
BRICS’ push for institutional reform and alternatives like the NDB signals a shift away from Western-dominated systems.Military and Strategic Power:
While NATO ensures that G7 retains military dominance, BRICS is growing in strategic alignment and defense collaboration.Cultural Competition:
BRICS nations are leveraging their cultural strengths to compete with G7’s historical dominance in global media and education.
Conclusion
The rise of BRICS presents a paradigm shift in global economic, political, and cultural dynamics. As BRICS nations gain influence through rapid economic growth, strategic resource control, and expanding trade networks, the traditional dominance of the G7 is increasingly challenged.
Key Takeaways
Economic and Trade Dynamics:
BRICS’ combined GDP (PPP) already surpasses the G7, with nominal GDP projected to follow by 2035.
The bloc’s trade share is expected to rise to 35% by 2040, overtaking G7 dominance.
De-Dollarization and Currency Influence:
BRICS' shift toward local currencies and the potential for a unified reserve currency could weaken the US dollar’s global supremacy.
By 2040, BRICS currencies may account for up to 20-25% of global reserves.
Energy and Resource Advantage:
BRICS controls significant shares of global oil, natural gas, and rare earth reserves, securing its dominance in critical industries.
Renewable energy investments in China and Brazil strengthen the bloc’s future readiness.
Geopolitical Implications:
BRICS is reshaping global governance with institutions like the New Development Bank and advocating for UN reform.
Cultural soft power and growing military collaboration enhance its global presence.
The Road Ahead
While BRICS has clear advantages, challenges remain. Internal cohesion among members, political instability, and competition from G7 nations in technological innovation could temper its ascent. However, the trajectory indicates a more multipolar world by 2040, where BRICS and G7 share the global stage.
